キーワードは、
[1]速度と視野角
[2]前車との相対関係
視野角での有効視野面積に占める 前車の形状の占有面積を
経験から、速度に関係なく、相対値で保持する傾向があることが判明した。
ベテランと初心者のドライバで、ばらつきがあるが、
前車との追従運転により、時間の経過とともに、適正値に落ち着くものと
考えられる。
The key word is
[1]Speed and viewing angle
[2]Relative relation to preceding vehicle
It turned out to tend to maintain the occupation area of shape in the preceding vehicle that occupied it to the effective view area in the viewing angle from the experience by a relative value regardless of the speed.
Though it is uneven in the old-timer and beginner's driverIt is thought that it settles down in a proper value with the time passage by the follow driving with the preceding vehicle.
~~~
この考えで、車間警告機能を実現できる、、、
The warning function between cars can be achieved by this idea.
~~~
(google検索:時速 視野角)
(google検索:車速 視野角)
で、検索したら、短時間であるが以下が引っかかった。
TODO)内容のチェック要!
(google retrieval: Per hour viewing angle)
(google retrieval: Viewing angle of velocity of car)
The following were caught though a short time when .... retrieving it.
TODO) Check main point of content.
~~~
[1]
http://www.denso.co.jp/ja/aboutdenso/technology/dtr/v12_1/files/18.pdf
運転者の視覚認知機能の解明とモデル化の研究
Clarification of driving person's sight acknowledgment function and research of modeling
2008/06/30追記)
ドライバは先行車の視覚的な面積変化をもって接近・離間検出をおこなっているという仮説のもと、「ドライバは前車との車間距離変化を前車の視覚的面積変化として認識し加減速操作をおこなっている」
とあるが、視野角との関係には、明確に言及していない。
The driver is original of the hypothesis of having a visual area change of the proceeding vehicle and doing the approach and the alienation detection. The driver recognizes the distance change between cars with the preceding vehicle as a visual area change in the preceding vehicle and is operating the addition and subtraction velocity.
The relation to the viewing angle is not clearly referred.
~~~
[2]
http://www.j-tokkyo.com/2002/H04N/JP2002-152718.shtml
【発明の名称】 画像処理装置
【 title of invention 】Image processor
【発明者】 【氏名】山田 正博
【要約】 【課題】画像処理のためにメモリに格納する画像データの量を少なくし、かつ必要な画像を得る。
【発明の詳細な説明】【0001】
【発明の属する技術分野】本発明は、車両のルームミラーの位置等に取り付けたビデオカメラにより撮像した前方の道路状況を画像処理し、レーンマークや車両等を検出する画像処理装置に関する。
This invention processes the road situation of which it takes picture with the video camera installed in the position etc. of the room mirror of the vehicle forward in the image, and concerns the image processor that detects the lane mark and the vehicle, etc.
@@@
本発明では走行速度に応じて視野角を変更する。
@@@
また、図4に示すように、走行速度に応じて線形に連続的に視野角を変化させることもできる。図4は車速に対する視野角の変化の一例を示したグラフである。横軸は車速を表す時速であり、縦軸は視野角を表す。この例では時速40km/hのときに視野角を30°とし、それより速くなると視野角は小さくなり、遅くなると視野角は大きくなる。
Moreover, the viewing angle can be changed linear continuously by responding at the running speed as shown in Figure 4. Figure 4 is a graph where one example of the change in the viewing angle into the velocity of the car was shown. A horizontal axis is per hour which the velocity of the car is shown, and the spindle shows the viewing angle. When it becomes small, and the viewing angle slows when the viewing angle is assumed to be 30° in this example at the time of 40 km/h in per hour, and it quickens more than it, the viewing angle grows.
【出願人】【識別番号】000237592【氏名又は名称】富士通テン株式会社
【 those who apply 】【 name or name 】 Fujitsu Ten of 【 identification number 】000237592 Ltd.
~~~
[3]
http://www.j-tokkyo.com/2006/B60R/JP2006-182324.shtml
【発明の名称】 車両用警報装置
【 title of invention 】Alarm device for vehicle
【発明者】 【氏名】服部 彰
【住所又は居所】愛知県豊田市トヨタ町1番地 トヨタ自動車株式会社内
【 address or address 】In TOYOTA MOTOR CORPORATION one in Aichi Prefecture Toyota City Toyota town
【要約】 【課題】運転者の警報対象物についての認識遅れを緩和する車両用警報装置を提供すること。
Offer the alarm device for the vehicle where the recognition delay of driving person's warning object is eased.
TODO)特許の中身は見れないのか?見れたような、、、図が見たい!
~~~
TODO)レイノルズ数算出試行時の計算値を挿入する。メモ整理要!、当面、保留!
~~~
end
2008年6月29日日曜日

2008年6月28日土曜日
渋滞学:流量-密度グラフの意味(6)
Congestion study: Meaning of flowing quantity-density graph(6)
2008/06/21~2008/06/25)
とうとう、ゴールが見えてきました。
~~~
速度と視野角の関係は、
(速度と視野の広さ)視力0.1以上の範囲
The relation between the speed and the viewing angle
(speed and area of view)Eyesight is a range of 0.1 or more.
40 km/h -100 dgrees
70 km/h -65 dgrees
100 km/h-40 dgrees
とある。
~~~
100 km/h の時の車間:40m がメタ安定に近づいた値とすると、
前車の位置における有効視野面積に対する前車の占有面積の比率を求める。
※ここでは、 面積を円形として捉えている。楕円という考えもできるかも。
When assuming the value for 100km/h, 40m between cars to approach a steady meta, The ratio of the occupation areas of the preceding vehicle in the position of the preceding vehicle to the effective view area is requested.
- Here, the area is caught as a circle. Can you think, that is, the oval?
有効視野面積(A)=(車間*TAN(RADIANS(視野角度/2)))^2*PI()
前車の占有面積(B)=(車間*TAN(前車の幅の半分/車間))^2*PI()
比率(R)=前車の占有面積(B)/有効視野面積(A)
なお、前車の幅を 2m とした。
{Effective view area}(A)=({Between cars}*TAN(RADIANS({Viewing angle degree}/2)))^2*PI()
{Occupation area of preceding vehicle}(B)=({Between cars}*TAN({Half of width in preceding vehicle}/{Between cars}))^2*PI()
R=B/A
or
A=(TAN(RADIANS({Viewing angle degree}/2)))^2
B=(TAN({Half of width in preceding vehicle}/{Between cars}))^2
R=B/A
Width in the preceding vehicle was assumed to be 2m.
***
A(m^2)=(40*TAN(RADIANS(40/2)))^2*PI()=665.89
B(m^2)=(40*TAN(1/40))^2*PI()=3.14
R=3.14/665.89=47.2e-4
or
R=(TAN(1/40))^2/(TAN(RADIANS(40/2)))^2
***
他の速度で、R=47.2e-4 に近くなるように、車間を手で微調整した結果、以下となった。
It fine-tuned between cars by the hand to become near R=47.2e-4 other speeds, therefore it became it as follows.
他の速度の場合の視野角の情報がないが、上記の3点の線形?として
以下とした場合で、比率:Rを求める。
Is it the above-mentioned linear though there is no information on the viewing angle for other speeds in three points?The ratio when it is time when it made it as follows ..making it..: R is obtained.
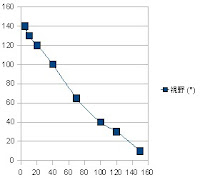 X軸:速度(km/h) ,speed
Y軸:視野角(dgrees) ,Viewing angle
~~~
これから、基本図を作成するために、密度と流量を求める。
密度(台/km)=1000(m)/車間(m)
流量(台/5mins)=密度(台/km)*速度(km/h)/(60/5)
Hereafter, to make a basic chart, the density and flowing quantity are requested.
density(cars/km)=1000(m)/{Between cars}(m)
{flowing quantity}(cars/5mins)=density(cars/km)*speed(km/h)/(60/5)
とうとう、ゴールが見えてきました。
~~~
速度と視野角の関係は、
(速度と視野の広さ)視力0.1以上の範囲
The relation between the speed and the viewing angle
(speed and area of view)Eyesight is a range of 0.1 or more.
40 km/h -100 dgrees
70 km/h -65 dgrees
100 km/h-40 dgrees
とある。
~~~
100 km/h の時の車間:40m がメタ安定に近づいた値とすると、
前車の位置における有効視野面積に対する前車の占有面積の比率を求める。
※ここでは、 面積を円形として捉えている。楕円という考えもできるかも。
When assuming the value for 100km/h, 40m between cars to approach a steady meta, The ratio of the occupation areas of the preceding vehicle in the position of the preceding vehicle to the effective view area is requested.
- Here, the area is caught as a circle. Can you think, that is, the oval?
有効視野面積(A)=(車間*TAN(RADIANS(視野角度/2)))^2*PI()
前車の占有面積(B)=(車間*TAN(前車の幅の半分/車間))^2*PI()
比率(R)=前車の占有面積(B)/有効視野面積(A)
なお、前車の幅を 2m とした。
{Effective view area}(A)=({Between cars}*TAN(RADIANS({Viewing angle degree}/2)))^2*PI()
{Occupation area of preceding vehicle}(B)=({Between cars}*TAN({Half of width in preceding vehicle}/{Between cars}))^2*PI()
R=B/A
or
A=(TAN(RADIANS({Viewing angle degree}/2)))^2
B=(TAN({Half of width in preceding vehicle}/{Between cars}))^2
R=B/A
Width in the preceding vehicle was assumed to be 2m.
***
A(m^2)=(40*TAN(RADIANS(40/2)))^2*PI()=665.89
B(m^2)=(40*TAN(1/40))^2*PI()=3.14
R=3.14/665.89=47.2e-4
or
R=(TAN(1/40))^2/(TAN(RADIANS(40/2)))^2
***
他の速度で、R=47.2e-4 に近くなるように、車間を手で微調整した結果、以下となった。
It fine-tuned between cars by the hand to become near R=47.2e-4 other speeds, therefore it became it as follows.
速度(km/h) speed | 視野角(degrees) Viewing angle | 車間(m) between car | 速度(m/s) speed | R(1e-4) |
40 | 100 | 12.25 | 11.11 | 47.13 |
70 | 65 | 22.85 | 19.44 | 47.25 |
100 | 40 | 40 | 27.78 | 47.2 |
他の速度の場合の視野角の情報がないが、上記の3点の線形?として
以下とした場合で、比率:Rを求める。
Is it the above-mentioned linear though there is no information on the viewing angle for other speeds in three points?The ratio when it is time when it made it as follows ..making it..: R is obtained.
 X軸:速度(km/h) ,speed
Y軸:視野角(dgrees) ,Viewing angle
~~~
速度(km/h) speed | 視野角(degrees) Viewing angle | 車間(m) between car | 速度(m/s) speed | R(1e-4) |
5 | 140 | 5.37 | 1.39 | 47.11 |
10 | 130 | 6.85 | 2.78 | 47.01 |
20 | 120 | 8.45 | 5.56 | 47.12 |
40 | 100 | 12.25 | 11.11 | 47.13 |
70 | 65 | 22.85 | 19.44 | 47.25 |
100 | 40 | 40 | 27.78 | 47.2 |
120 | 30 | 54.35 | 33.33 | 47.16 |
150 | 10 | 166.5 | 41.67 | 47.13 |
これから、基本図を作成するために、密度と流量を求める。
密度(台/km)=1000(m)/車間(m)
流量(台/5mins)=密度(台/km)*速度(km/h)/(60/5)
Hereafter, to make a basic chart, the density and flowing quantity are requested.
density(cars/km)=1000(m)/{Between cars}(m)
{flowing quantity}(cars/5mins)=density(cars/km)*speed(km/h)/(60/5)
速度(km/h) speed | 車間(m) Between cars | 密度(台/km) density(cars/km) | 流量(台/5mins) flowing quantity(cars/5mins) |
5 | 5.37 | 186.39 | 77.66 |
10 | 6.85 | 145.99 | 121.65 |
20 | 8.45 | 118.34 | 197.24 |
40 | 12.25 | 81.63 | 272.11 |
70 | 22.85 | 43.76 | 255.29 |
100 | 40 | 25 | 208.33 |
120 | 54.35 | 18.4 | 183.99 |
150 | 166.5 | 6.01 | 75.08 |
 X軸:密度(台/km) ,density(cars/km)
Y軸:流量(台/5mins) , flowing quantity(cars/5mins)
あとは、これに運転手の習熟度合いで、バラツキが発生するグラフになる。
It becomes a graph where the difference is generated by being in this the proficiency combination of the driver.
end
渋滞学:流量-密度グラフの意味(5)
2008/06/21)
再度、方向転換?
渋滞学、p.46)基本図の傾向を探るは変更なし。
制動距離の考えから離れる。
Again, turnabout?The congestion study and p.46) It is ..search.. change none as for tendency in a basic chart. It parts from the idea of the slip distance for brake.
~~~
人は車間をどのように判断しているのか?
高速道路から一般道路に入ったときの、速度間隔が鈍るのは、、、
How is the person judging between cars?The speed interval's when entering the public highway from the expressway becoming duller
~~~
相対速度、、、
速度に応じて、視野が狭まる
視野の中における前車の占有面積の割合から、車間を判断しているのでは?
Relative speed...View narrows responding at the speed. Is it judged from the ratio of the occupation area of the preceding vehicle in view between cars?
~~~
よもや、制動距離を意識して、車間をとっているのではない、、、
It doesn't take between cars considering the slip distance for brake possibly.
~~~
ここから、速度と視野の関係を調べはじめる。
It begins to examine the relation between the speed and view from here.
2008/06/21)
車きました。仕事終電です。日曜日も出です。何か、eventがここでは圧縮されてきました。WOOOO...
end
再度、方向転換?
渋滞学、p.46)基本図の傾向を探るは変更なし。
制動距離の考えから離れる。
Again, turnabout?The congestion study and p.46) It is ..search.. change none as for tendency in a basic chart. It parts from the idea of the slip distance for brake.
~~~
人は車間をどのように判断しているのか?
高速道路から一般道路に入ったときの、速度間隔が鈍るのは、、、
How is the person judging between cars?The speed interval's when entering the public highway from the expressway becoming duller
~~~
相対速度、、、
速度に応じて、視野が狭まる
視野の中における前車の占有面積の割合から、車間を判断しているのでは?
Relative speed...View narrows responding at the speed. Is it judged from the ratio of the occupation area of the preceding vehicle in view between cars?
~~~
よもや、制動距離を意識して、車間をとっているのではない、、、
It doesn't take between cars considering the slip distance for brake possibly.
~~~
ここから、速度と視野の関係を調べはじめる。
It begins to examine the relation between the speed and view from here.
2008/06/21)
車きました。仕事終電です。日曜日も出です。何か、eventがここでは圧縮されてきました。WOOOO...
end
渋滞学:流量-密度グラフの意味(4)
2008/06/17)
方針転換?
***
Reを導き出す?のは中断!した感がある。復活できるか?かなり、落ち込んでいます。
渋滞学、p.46)の基本図の傾向は、どのようなルールなのか?
***
渋滞学、p.48)
「車間距離40km/hで渋滞が発生する。
1車線、密度=25台/kmで、車間=40m
自由走行している車が急ブレーキを踏んでギリギリ止まれる制動距離に等しい。」
と記述あり。
Congestion study and p.48)「Congestion occurs at the distance 40 km/h between cars. It is equal to the slip distance for brake that hits the brakes with 1 lane and density =25/the km by the car that freely runs =40m between cars and can stop in the very limit. 」 It describes and it exists.
~~~
速度と制動距離の関係から、基本図ができているのか?
Does a basic chart consist of the relation between the speed and the slip distance for brake?
~~~
密度低い~メタ安定までは、制限時速(100km/h?)で制限されているような。
メタ安定後、渋滞になるまでの車間のルールは?
Density low. Will not be limited the meta with stability by limitation per hour (100 km/h?). The rule between cars to becoming after meta stabilizes congestion?
~~~
車間に関して、
車が一秒間に進む距離(m/s)と
制動距離との関係は見えない。
For between carsThe car will not see the relation between advanced distance (m/s) and the slip distance for brake in one second.
~~~
逆に、制動距離を意識して走行していないような、車間が短い、、、
Oppositely, it is short between cars not running considering the slip distance for brake.
@@@
自分の場合で考えるとそうかも、、、低速?走行しているので、、、、(燃費走行とも言える?)
@@@
~~~
検索して、「車間の2秒ルール」を知りました、、、
It retrieved, and it knew "Rule for two seconds between cars".
end
方針転換?
***
Reを導き出す?のは中断!した感がある。復活できるか?かなり、落ち込んでいます。
渋滞学、p.46)の基本図の傾向は、どのようなルールなのか?
***
渋滞学、p.48)
「車間距離40km/hで渋滞が発生する。
1車線、密度=25台/kmで、車間=40m
自由走行している車が急ブレーキを踏んでギリギリ止まれる制動距離に等しい。」
と記述あり。
Congestion study and p.48)「Congestion occurs at the distance 40 km/h between cars. It is equal to the slip distance for brake that hits the brakes with 1 lane and density =25/the km by the car that freely runs =40m between cars and can stop in the very limit. 」 It describes and it exists.
~~~
速度と制動距離の関係から、基本図ができているのか?
Does a basic chart consist of the relation between the speed and the slip distance for brake?
~~~
密度低い~メタ安定までは、制限時速(100km/h?)で制限されているような。
メタ安定後、渋滞になるまでの車間のルールは?
Density low. Will not be limited the meta with stability by limitation per hour (100 km/h?). The rule between cars to becoming after meta stabilizes congestion?
~~~
車間に関して、
車が一秒間に進む距離(m/s)と
制動距離との関係は見えない。
For between carsThe car will not see the relation between advanced distance (m/s) and the slip distance for brake in one second.
~~~
逆に、制動距離を意識して走行していないような、車間が短い、、、
Oppositely, it is short between cars not running considering the slip distance for brake.
@@@
自分の場合で考えるとそうかも、、、低速?走行しているので、、、、(燃費走行とも言える?)
@@@
~~~
検索して、「車間の2秒ルール」を知りました、、、
It retrieved, and it knew "Rule for two seconds between cars".
end
渋滞学:流量-密度グラフの意味(3)
2008/06/xx)
車速は、以下の式と、渋滞学:p.46のグラフから求められる。
流量(台/h)=速度(km/h)×密度(台/km)
逆算した結果が何を意味しているのか?
この作業は、何を目的にしているのか? 不明確になりつつあった。
~~~
2008/06/26):補足
Re=(密度ρ×流速u×直径d)/粘性係数μ
流量(台/h)=速度(km/h)×密度(台/km)
から、
Re=(流量×直径d)/粘性係数μ
直径、粘性係数=一定ならば、Reは、流量に比例する。
~~~
車は、渋滞すると、空気みたいに圧縮して速度を増すことにはならないので、
速度は頭打ちになる。
つまり、
流量が何とか以上が乱流とかは定義できない、、、
end
車速は、以下の式と、渋滞学:p.46のグラフから求められる。
流量(台/h)=速度(km/h)×密度(台/km)
逆算した結果が何を意味しているのか?
この作業は、何を目的にしているのか? 不明確になりつつあった。
~~~
2008/06/26):補足
Re=(密度ρ×流速u×直径d)/粘性係数μ
流量(台/h)=速度(km/h)×密度(台/km)
から、
Re=(流量×直径d)/粘性係数μ
直径、粘性係数=一定ならば、Reは、流量に比例する。
~~~
車は、渋滞すると、空気みたいに圧縮して速度を増すことにはならないので、
速度は頭打ちになる。
つまり、
流量が何とか以上が乱流とかは定義できない、、、
end
渋滞学:流量-密度グラフの意味(2)
2006/06/12~)
ここから、レイノルズ数を求める試み)
円管の場合)
Re=(密度ρ×流速u×直径d)/粘性係数μ
Re:レイノルズ数、単位なし
ρ:kg/m^3
u:m/s
d:m
μ:Pa・s
あるいは、
Re=(流速u×直径d)/動粘性係数ν
ν:m^2/s
~~~
車の場合は、それぞれ何になるか?
車線は限定で、それ以外に行きようがないので、管内に近い、、、?
強引に、※これは頭の体操か?
密度ρ(kg/m^3) :密度(台/km)?
:車の重さ関係する? 平均:>1t?、大型車、小型車とか。
流速u(m/s) :車の速度(km/h)?
直径d(m) :車線の幅(m)?
~~~
Re=2300で、粘性係数を逆算してもしたりした。同様に、動粘性係数も逆算できる、、、か。
粘性係数を求めても何か意味があるか?
~~~
DO図書館)
道具としての流体力学 (単行本) 山口 浩樹 (著), 松本 洋一郎
p.22で、液体、気体の粘性係数の表あり。
計算した?自由走行の粘性係数を比較した。
結果は?:ひまし油に近い?とか、計算違い???:何かあやしい、、、
***
p.22)
粘性係数(1e-6 Pa・s)
空気 :18.2
***
p.66)
温度290K、動粘性係数(m^2/s)
水 :1.14e-6
空気 :14.6e-6
人・車 :更に大きい値???
***
密度(kg/m^3)
空気 :1.2
ヘリウム:0.18
水 :1000
~~~
end
ここから、レイノルズ数を求める試み)
円管の場合)
Re=(密度ρ×流速u×直径d)/粘性係数μ
Re:レイノルズ数、単位なし
ρ:kg/m^3
u:m/s
d:m
μ:Pa・s
あるいは、
Re=(流速u×直径d)/動粘性係数ν
ν:m^2/s
~~~
車の場合は、それぞれ何になるか?
車線は限定で、それ以外に行きようがないので、管内に近い、、、?
強引に、※これは頭の体操か?
密度ρ(kg/m^3) :密度(台/km)?
:車の重さ関係する? 平均:>1t?、大型車、小型車とか。
流速u(m/s) :車の速度(km/h)?
直径d(m) :車線の幅(m)?
~~~
Re=2300で、粘性係数を逆算してもしたりした。同様に、動粘性係数も逆算できる、、、か。
粘性係数を求めても何か意味があるか?
~~~
DO図書館)
道具としての流体力学 (単行本) 山口 浩樹 (著), 松本 洋一郎
p.22で、液体、気体の粘性係数の表あり。
計算した?自由走行の粘性係数を比較した。
結果は?:ひまし油に近い?とか、計算違い???:何かあやしい、、、
***
p.22)
粘性係数(1e-6 Pa・s)
空気 :18.2
***
p.66)
温度290K、動粘性係数(m^2/s)
水 :1.14e-6
空気 :14.6e-6
人・車 :更に大きい値???
***
密度(kg/m^3)
空気 :1.2
ヘリウム:0.18
水 :1000
~~~
end
渋滞学:流量-密度グラフの意味(1)
Congestion study: Meaning of flowing quantity-density graph(1)
またまた、わき道にそれました。
貧乏ひまなし状態と15年ぶりに車購入で、資金難のために、6月のエネルギーを
使い果たしました。
が、素数の探求で何かやろうとはしています。
今回は、渋滞学です。
思考期間:2008/06/12~2008/06/25、この後、メモ整理。頭の冷却期間、、、続く。
DO図書館):再読
渋滞学 (新潮選書) (単行本) 西成 活裕 (著)
p.46)基本図?:人型、ラムダ型とも言われている。
貧乏ひまなし状態と15年ぶりに車購入で、資金難のために、6月のエネルギーを
使い果たしました。
が、素数の探求で何かやろうとはしています。
今回は、渋滞学です。
思考期間:2008/06/12~2008/06/25、この後、メモ整理。頭の冷却期間、、、続く。
DO図書館):再読
渋滞学 (新潮選書) (単行本) 西成 活裕 (著)
p.46)基本図?:人型、ラムダ型とも言われている。

感じとしては、密度低い~メタ安定までは、層流で、メタ安定~密度高い方は、乱流に見える。
自由走行でのメタ安定部分は、レイノルズ数=2300近辺になるのか?それとも、、、
As feeling, density low. Meta stability to meta stability because of laminar air flow?Density high looks like the war. Does the meta stability part in a free running become about Reynolds number =2300?Or,
~~~
結論として、レイノルズ数の割出には失敗したが、
グラフの傾向線に近似したルールを発見できた。後述する。
In conclusion, the rule approximated to the trend line in the graph was able to be discovered though it failed in the crack going out of the Reynolds number. It describes it later.
end
登録:
投稿 (Atom)
